A109
Difference between revisions of "A109"
m |
m |
||
| (14 intermediate revisions by the same user not shown) | |||
| Line 1: | Line 1: | ||
The activities associated with the selection of the key metrics for each performance attribute for each supply chain. A scorecard is used to define the metrics of most interest to an organization, to arrange them by area of impact, by business priority, and to provide a container for later benchmarking comparisons. Each scorecard is built from a subset of hundreds of {{OR}} metrics. | The activities associated with the selection of the key metrics for each performance attribute for each supply chain. A scorecard is used to define the metrics of most interest to an organization, to arrange them by area of impact, by business priority, and to provide a container for later benchmarking comparisons. Each scorecard is built from a subset of hundreds of {{OR}} metrics. | ||
| − | === | + | ===Use Cases=== |
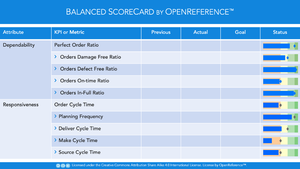
| − | [[File:OR-BSC.png|thumb|Balanced Scorecard example]]A standard method to analyze the performance of supply chains is the use of [[t:BSC|Balanced Scorecards]]. A [[t:BSC]] consists of a limited number of agreed, well-defined metrics, categorized by business perspective. | + | <p>[[File:OR-BSC.png|thumb|Balanced Scorecard example]][[t:BSC]]: A standard method to analyze the performance of supply chains is the use of [[t:BSC|Balanced Scorecards]]. A [[t:BSC]] consists of a limited number of agreed, well-defined metrics, categorized by business perspective. </p> |
An example of such metrics are the level-1 [[SCPM|metrics]] for each [[Attribute|Attribute]] defined in {{OR}}. Where necessary the level-2, 3, and 4 metrics are available to analyze and explain deviations between scorecard targets and actuals for each metric. | An example of such metrics are the level-1 [[SCPM|metrics]] for each [[Attribute|Attribute]] defined in {{OR}}. Where necessary the level-2, 3, and 4 metrics are available to analyze and explain deviations between scorecard targets and actuals for each metric. | ||
| − | + | ||
| − | [[File:OR-BSM.png|thumb|Business Strategy Map template]]A [[t:BSM]] | + | A {{OR}} supply chain scorecard typically consists of 6-10 level-1 metrics. |
| + | |||
| + | |||
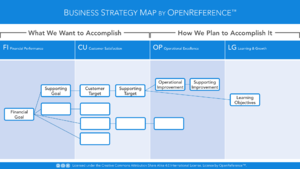
| + | [[File:OR-BSM.png|thumb|Business Strategy Map template]][[t:BSM]]: {{OR}} recommends the use of a [[t:BSM]] to visualize and/or communicate the linkage between the business priorities and the metrics/attributes in a scorecard. | ||
| + | |||
| + | A [[t:BSM]] is typically created (and appended to the scorecard) after the supply chain strategy has been defined or refreshed and after the initiatives to operationalize/implement such strategy ('strategic initiatives') have been defined, planned, and funded. | ||
===Notes=== | ===Notes=== | ||
| − | [[sc:A101|Busines plan review]] is a key step prior to defining scorecards. Without a deep understanding of the business plan, metrics are typically not --clearly-- linked to business priorities. | + | * [[sc:A101|Busines plan review (A101)]] is a key step prior to defining scorecards. Without a deep understanding of the business plan, metrics are typically not --clearly-- linked to business priorities. Consider developing the [[t:BSM]] to reveal any gaps in linkage between priorities and metrics. |
| − | The [[sc:A102| | + | * The [[sc:A102|Discovery (A102)]] and [[sc:A108|Documentation/Definition (A108)]] of supply chains are a key preceding steps. Without clearly defined supply chains, scorecards may contain aggregate data of conflicting supply chain types e.g. [[Link::t:MTO]] and [[Link::t:MTS]] together. |
| − | + | <ins>[[Link:t:GRC4]]</ins> | |
[[Category:Process]][[Category:Supply Chain]] | [[Category:Process]][[Category:Supply Chain]] | ||
{{Object | {{Object | ||
Latest revision as of 19:05, 17 November 2021
The activities associated with the selection of the key metrics for each performance attribute for each supply chain. A scorecard is used to define the metrics of most interest to an organization, to arrange them by area of impact, by business priority, and to provide a container for later benchmarking comparisons. Each scorecard is built from a subset of hundreds of OpenReference metrics.
Contents
[hide]Use Cases
Balanced Scorecard: A standard method to analyze the performance of supply chains is the use of Balanced Scorecards. A Balanced Scorecard consists of a limited number of agreed, well-defined metrics, categorized by business perspective.An example of such metrics are the level-1 Metrics for each Performance Attribute defined in OpenReference. Where necessary the level-2, 3, and 4 metrics are available to analyze and explain deviations between scorecard targets and actuals for each metric.
A OpenReference supply chain scorecard typically consists of 6-10 level-1 metrics.
A Business Strategy Map is typically created (and appended to the scorecard) after the supply chain strategy has been defined or refreshed and after the initiatives to operationalize/implement such strategy ('strategic initiatives') have been defined, planned, and funded.
Notes
- Busines Plan Review (A101) is a key step prior to defining scorecards. Without a deep understanding of the business plan, metrics are typically not --clearly-- linked to business priorities. Consider developing the Business Strategy Map to reveal any gaps in linkage between priorities and metrics.
- The Discovery (A102) and Documentation/Definition (A108) of supply chains are a key preceding steps. Without clearly defined supply chains, scorecards may contain aggregate data of conflicting supply chain types e.g. Make-to-Order and Make-to-Stock together.
Discuss Contract Custom Solution
Workflow
| Process |
| ||||||||||||||||||
|---|---|---|---|---|---|---|---|---|---|---|---|---|---|---|---|---|---|---|---|---|
|
A109 |
|
||||||||||||||||||

